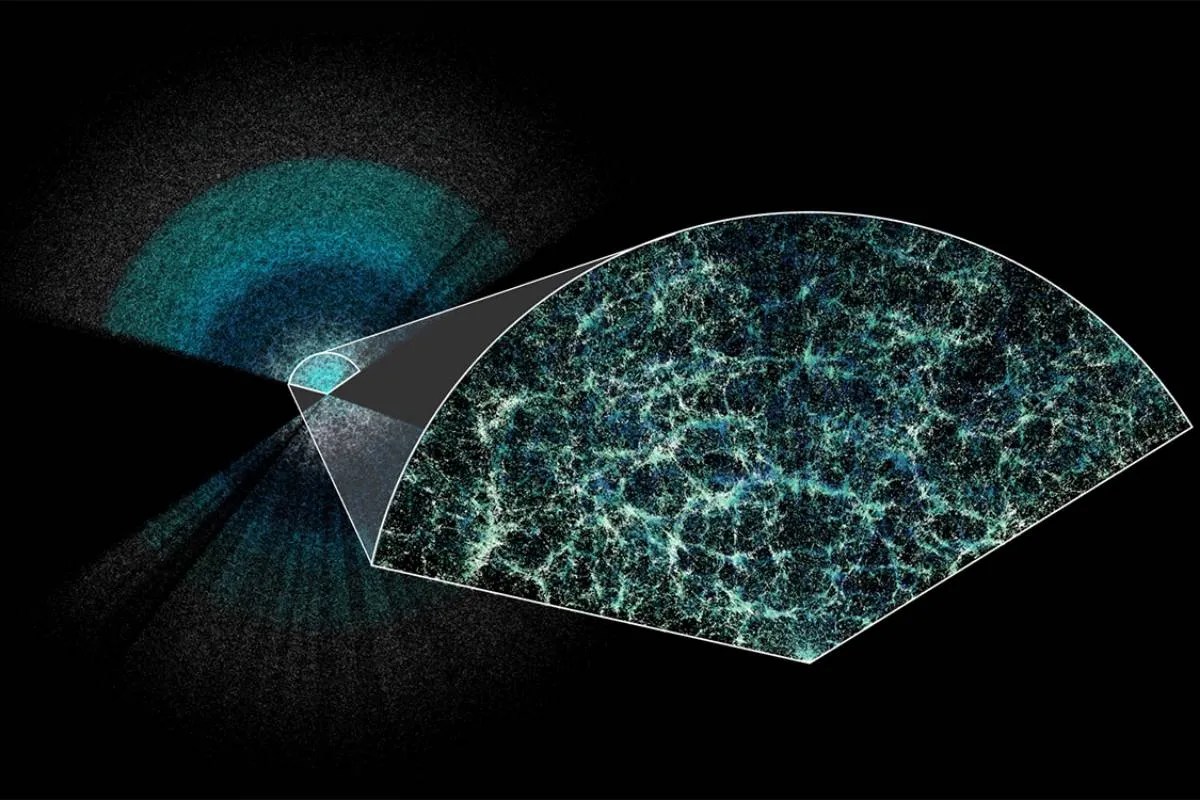
The completion of the largest 3D map of the universe by the Dark Energy Spectroscopic Instrument (DESI) signifies a transition from observational astronomy to precision cosmology. This mapping effort does not merely catalog galactic coordinates; it provides the empirical foundation required to test the standard model of cosmology, specifically the Lambda Cold Dark Matter ($\Lambda$CDM) framework. By measuring the positions and velocities of over 30 million galaxies and 3 million quasars, DESI has established a dataset that allows for the measurement of the universe's expansion history with a precision exceeding 1%.
The Mechanics of Baryon Acoustic Oscillations
The structural integrity of this 3D map relies on Baryon Acoustic Oscillations (BAO). These are essentially "standard rulers" frozen into the distribution of matter. In the early universe, the competition between gravitational pull and radiation pressure created spherical sound waves in the plasma. When the universe cooled sufficiently for atoms to form (recombination), these waves stalled, leaving behind a characteristic overdensity of matter at a specific scale—approximately 150 megaparsecs.
DESI utilizes these frozen ripples to measure the expansion of space over time. By observing the apparent size of these BAO features at different redshifts ($z$), researchers can calculate the distance to those objects and, by extension, the rate of expansion (the Hubble parameter, $H(z)$). This creates a direct link between the physical state of the universe 380,000 years after the Big Bang and the distribution of galaxies observed today.
The Spectroscopic Advantage over Photometric Surveys
Previous mapping attempts often relied on photometry, which estimates distances based on the color and brightness of objects. This method introduces significant "redshift space distortions" and high margins of error. DESI operates via a massively parallel spectroscopic system located at the Kitt Peak National Observatory.
The system utilizes 5,000 automated robotic positioners, each holding a fiber-optic cable. These robots can align with targets in seconds, allowing the instrument to capture the light spectra of 5,000 celestial objects simultaneously. The spectroscopic approach decomposes light into its constituent wavelengths, providing a "fingerprint" of the chemical composition and, crucially, a precise measurement of redshift. This precision transforms a fuzzy 2D projection into a high-fidelity 3D volume, reducing the uncertainty in distance measurements to a negligible fraction compared to previous wide-field surveys.
Deciphering the Dark Energy Equation of State
The primary objective of this five-year success is to constrain the dark energy equation of state, denoted by $w$. In the simplest version of the $\Lambda$CDM model, dark energy is a cosmological constant where $w = -1$. This implies that the density of dark energy remains constant as the universe expands.
However, early data from the DESI survey suggests a potential deviation from this constant. If $w$ is found to evolve over time—a "quintessence" model—it would necessitate a complete overhaul of general relativity or the introduction of new fundamental forces.
- Fixed $w$: Dark energy is a property of space itself (Vacuum Energy).
- Variable $w(a)$: Dark energy is a dynamic field that changes as the universe scales ($a$).
The DESI map provides the density fluctuations required to observe whether the "push" of dark energy has accelerated at a uniform rate or if there are nuances in its behavior across different cosmic epochs. The data spans 11 billion years of history, filling the critical "middle age" gap in our cosmic timeline where dark energy began to dominate over the gravitational pull of dark matter.
Constraints on Neutrino Mass and Inflationary Theory
Beyond dark energy, the 3D map functions as a laboratory for particle physics. The growth of large-scale structures is sensitive to the sum of neutrino masses. Because neutrinos are "hot" dark matter—moving at relativistic speeds—they tend to smooth out small-scale fluctuations in the cosmic web. By analyzing the "clumpiness" of galaxies in the DESI map, cosmologists can place an upper bound on the total mass of all neutrino species.
This structural analysis also tests the "Gaussianity" of the initial conditions of the universe. According to inflationary theory, the universe underwent a rapid expansion in its first trillionth of a second. Any non-Gaussian signatures in the distribution of the 30 million mapped galaxies would provide evidence for specific versions of inflation, potentially ruling out simpler models in favor of more complex, multi-field interactions.
The Computational Bottleneck and Data Processing
Generating a map of this scale is as much a triumph of software engineering as it is of optics. The raw data captured by the 5,000 fibers must be processed through a rigorous pipeline:
- Signal Extraction: Distinguishing faint galactic signatures from atmospheric noise and terrestrial light pollution.
- Redshift Assignment: Automated cross-correlation of spectra against templates to determine precise velocity and distance.
- Clustering Analysis: Using two-point correlation functions to identify the BAO signal within the vast "noise" of individual galactic movements.
The hardware utilized involves a focal plane that moves with micron-level precision, ensuring that the light from a galaxy millions of light-years away hits a fiber only 100 microns wide. This mechanical reliability, maintained over five years, enabled the collection of more galaxy spectra in its first year than all previous surveys combined.
The Hubble Tension and Structural Implications
One of the most significant stressors in modern physics is the "Hubble Tension"—the discrepancy between the expansion rate measured from the early universe (via the Cosmic Microwave Background) and the rate measured from the local universe (via Supernovae).
The DESI map acts as an intermediary. By providing a continuous anchor from high redshift to low redshift, it allows researchers to see if the "tension" is a result of a measurement error in the local universe or a fundamental misunderstanding of the physics governing the middle-aged universe. If the expansion rate measured by DESI aligns with the CMB data but disagrees with local measurements, it suggests that the local universe may be part of an underdense "void," or that our local calibration of distance (the "distance ladder") is flawed.
Identifying the Cosmic Web Anchors
The map reveals the large-scale structure of the universe, often referred to as the "Cosmic Web." This web consists of:
- Filaments: Long strands of dark matter and gas that serve as the highways of the universe.
- Nodes: Intersections of filaments where massive galaxy clusters reside.
- Voids: Vast, empty spaces that make up the majority of the universe's volume.
By quantifying the volume and distribution of these voids, DESI provides a different perspective on dark energy. Voids expand faster than the average rate of the universe because they lack the dark matter necessary to counteract the push of dark energy. The geometry of these voids in the 3D map serves as an independent check on the BAO measurements.
Technical Limitations and Systematic Uncertainties
Despite the success, the DESI map is subject to specific constraints. The survey is limited by "fiber collisions," where two galaxies are too close together in the sky for both to be targeted simultaneously. This creates a small-scale bias in the data that must be corrected through complex simulations. Furthermore, the survey is primarily conducted in the Northern Hemisphere, meaning a complete "all-sky" 3D map requires integration with southern surveys like the Vera C. Rubin Observatory’s future data.
The evolution of the instrument's performance is also tied to the "seeing" conditions at Kitt Peak. While the robotic positioners eliminate human error in targeting, atmospheric turbulence remains a variable that dictates the integration time required for each exposure.
Strategic Vector for Future Observations
The immediate priority for the cosmological community is the integration of DESI’s 3D spatial data with the weak lensing data from the Euclid satellite. While DESI measures the positions of galaxies, Euclid measures how the shapes of those galaxies are distorted by the gravity of intervening dark matter.
Combining these two datasets—the "position" and the "distortion"—will provide a 6D understanding of the cosmic evolution. This will allow for the separation of "modified gravity" effects from "dark energy" effects. If gravity behaves differently on billion-light-year scales than it does within our solar system, this combined dataset will be the first to prove it.
The focus must now shift toward the "non-linear" regime of structure formation. While BAO provides a clean signal on large scales, the way galaxies cluster on smaller scales contains untapped information about the nature of dark matter particles themselves—specifically whether they are truly "cold" or possess some level of self-interaction. The DESI dataset provides the statistical power to begin these inquiries, moving the field beyond the simple detection of expansion and into the dissection of the fundamental constituents of reality.